Archive
Watch this space…
Eric Wilson will update this blog Jan 1st, 2011.
For the latest Storm information
Please watch Local 6
Justweather.com
Oil Spill Home Page
Good Morning,
I have some links to add to the discussion this morning, and suggest you bookmark this oil blog as I will continue to update the links below as new information comes out.
This is an ever-growing oil blog and will be treated as a main page, rather than a separate blog. This will allow users (like you) to come back and check the links as every 3 hours the data changes.
It serves you best to just keep this link, and click on the highlighted text below to check the model data itself for the latest information
Here is the newest page, from the New Orleans National Weather Service
If you haven’t already seen the oil spill live broadcast cam from CNN.com, here is the link
Also, here is an updated site which will have the areas reporting oil along the Gulf Coast. From oil smell, to tar balls to oil itself any report of oil will be added to this site here
The computer models are always changing, and updating…so rather than a static image which over time will be changed/updated I will give you the link here
Here is the latest surface analysis showing the oil, the loop current and the eddies in place most recently
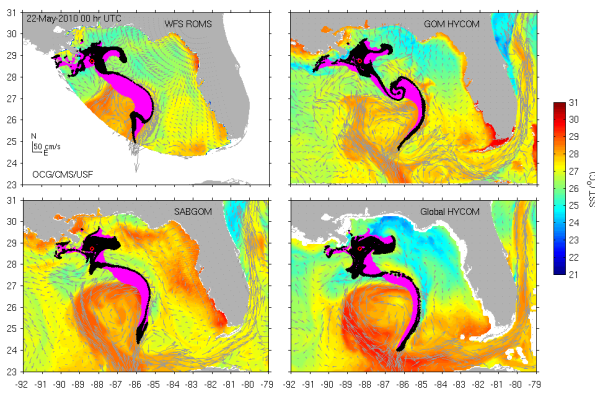
Also This additional set of maps shows the predicted location of oil that has potential entered the loop current
I will continue to add links to this post as the days roll along, and of course if there is any updated information I will add that discussion as well. Remember, this data changes every 3 hours (every second for the live broadcast).
My best,
Eric
Oil Spill as of May 20th, 2010
Good Morning,
Welcome to the new Oil Spill blog where I will post the latest model imagery and the thinking behind the projections provided by the solutions. This will be updated Monday through Friday (and on weekends when the oil gets closer to Florida’s east coast)
It is Thursday, May 20th and here is the latest…
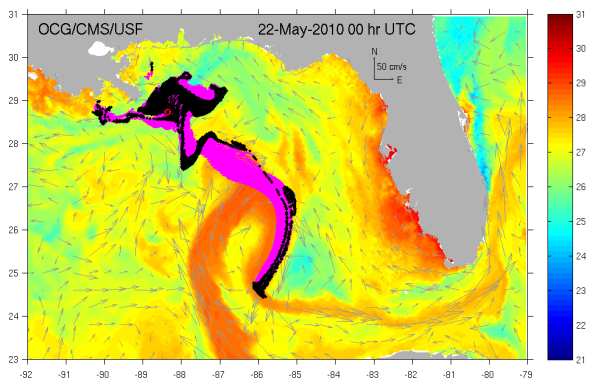
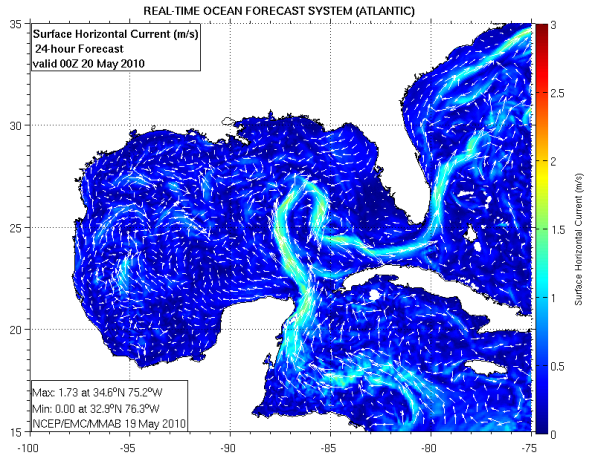
Now…the image below is just one model solution/projection for where the oil will be on Saturday night.
The Deepwater Horizon oil spill (in black) trajectory hindcast/forecast
based on RTOFS (Atlantic)
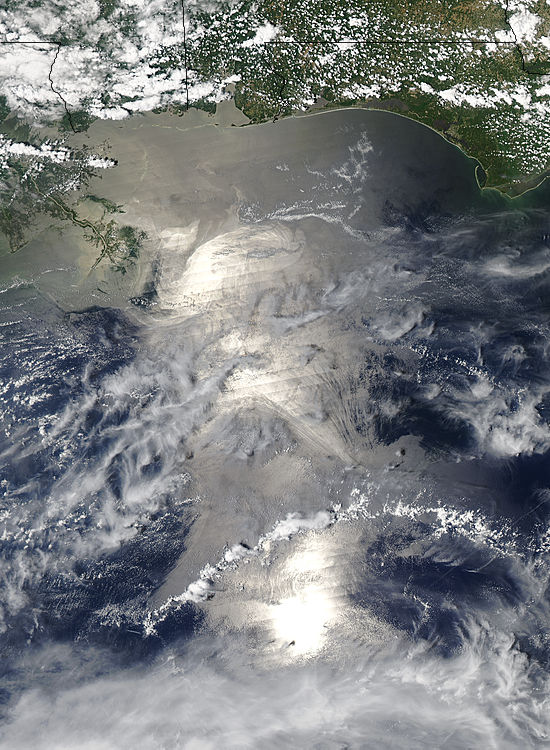
This the latest imagery with regards to the oil spill. Of note, not all images are within 24 hours, as cloud cover prevents daily updates for satellite imagery for one and location of specific satellites is another problem with tracking this spill with just visible images.
As this blog develops, I will post Radar imagery used by the Coast Guard and affiliates.
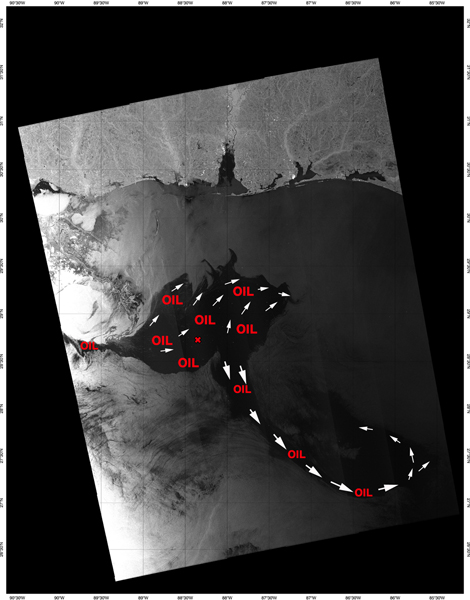
This is from May 19th, 2010…
This image from May 18th, 2010
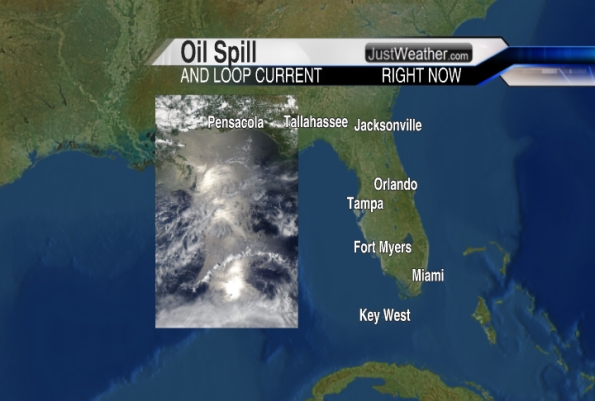
Where this is in the Gulf…
The oil and its direction have the loop current in play on the southern side of the spill
Loop current right now..
Here is a look at the model projections out to Satuday, May 22nd. Click on the link to see the animation yourself.
